- Home
- Blog
- Restaurant Automation KPIs: The Complete Guide to Dashboards, Automated Reporting, and Workflow Monitoring
AI Automations · 2 min read
Restaurant Automation KPIs: The Complete Guide to Dashboards, Automated Reporting, and Workflow Monitoring
Restaurant automation KPIs: discover how to build real-time dashboards, automate reporting, and monitor workflows end-to-end. Free consultation from InReality Solutions.
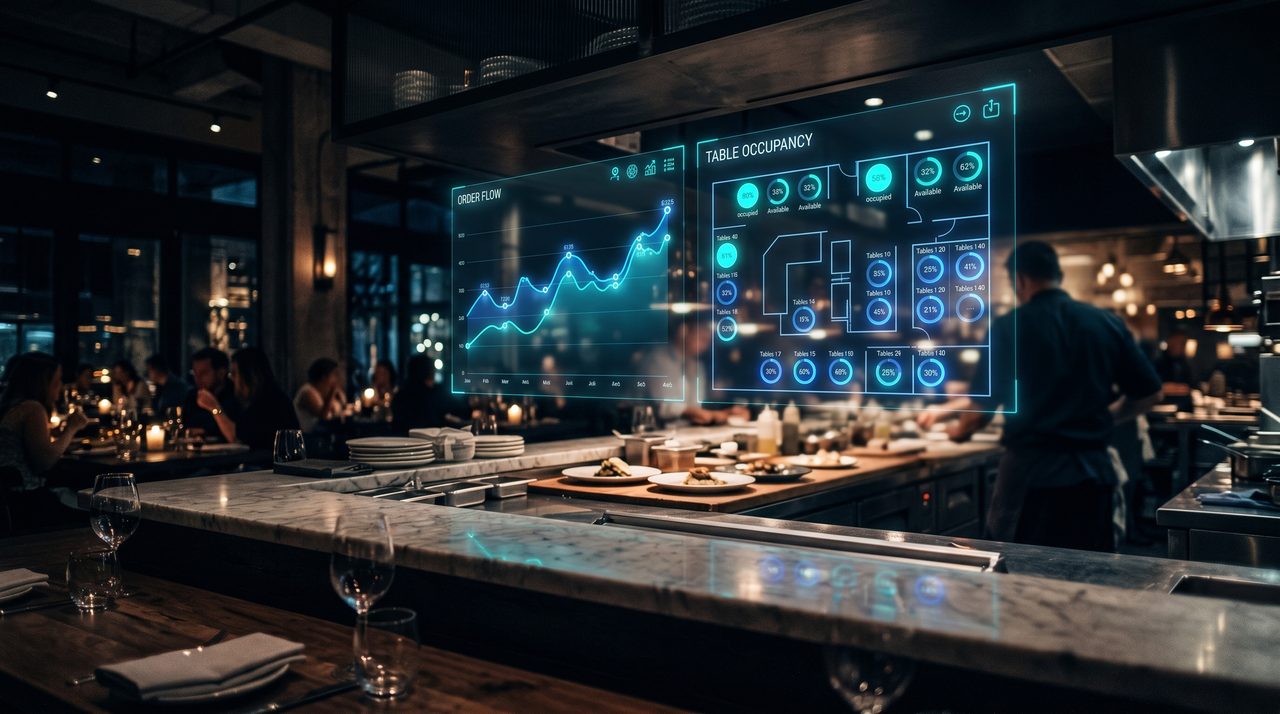
Indonesian restaurants that automate their KPI tracking are cutting food waste by double digits, reducing ticket times, and growing margins — all without hiring additional managers. By connecting your POS, KDS, inventory, reservation, and workforce systems into a single analytics layer, you gain real-time visibility into metrics such as average order value (AOV), food cost percentage, and table turnover rate. For multi-outlet operators in Jakarta, Surabaya, and beyond, this is no longer a luxury — it is a competitive necessity in an industry where margins are razor-thin and delivery platforms like Gojek and Grab add a new layer of operational complexity.
Why Restaurant KPI Automation Matters Right Now
Manual reporting in the restaurant industry is slow, error-prone, and almost always backwards-looking. KPI automation changes this equation entirely: data flows from source systems into a centralised dashboard in near-real-time, giving operators the ability to intervene while there is still time to make a difference. Concrete business benefits include faster service, reduced food waste, labour optimisation, and predictive insight through demand forecasting.
Core Restaurant KPIs to Automate
Revenue and Sales
- Total sales (daily / weekly / monthly)
- Average Order Value (AOV) = Total sales ÷ Number of transactions
- Sales by channel: dine-in, delivery, takeaway, online ordering
Financial and Margin KPIs
- Food cost % = (Total food cost ÷ Food sales) × 100. Target range typically 28–35%.
- Gross margin per menu item
- Labour cost % relative to total sales
Operations KPIs
- Average wait time (seated → first dish served)
- Table turnover rate = Number of covers served ÷ Number of tables
- Order accuracy rate / refund rate
Dashboard Design: Features, Layout, and Governance
Recommended dashboard layout: top row with summary KPI tiles (Total Sales, AOV, Food Cost %, Labour %, Table Turnover, NPS); middle section with time-series trend charts and heatmaps; bottom section with root-cause and anomaly widgets. Role-based views are essential: owner sees financial summary; floor manager sees table turnover and wait times; head chef sees kitchen throughput and SLA status.
Restaurant KPI Automation: Step-by-Step Implementation Roadmap
- Audit data and processes: Map all existing systems and identify manual reports that consume the most time.
- Define 8–12 priority KPIs: Select metrics that are actionable and directly linked to a business outcome.
- Select your platform and tools.
- Design dashboard and report templates: Create wireframes for each role-based view.
- Build the integration and ETL pipeline.
- Run a pilot at one outlet or one shift.
- Deploy incrementally and train staff.
- Conduct quarterly reviews.
How InReality Solutions Can Help Your Restaurant
InReality Solutions is a Jakarta-based technology company specialising in AI automation, agentic AI integration, and business process automation for Indonesian enterprises. For restaurant and F&B operators, our team delivers end-to-end solutions: from data pipeline architecture and POS integration through to dashboard design, automated reporting, and operational workflow monitoring.
Ready to implement restaurant automation KPIs that deliver measurable results? Book a free consultation with InReality Solutions to get started, or explore our AI automation services.
Frequently Asked Questions
What are the most important KPIs to track first when automating a restaurant's operations?
For most Indonesian restaurant operators, the highest-impact starting point is a focused set of three to five metrics: ticket time (order to table), Average Order Value (AOV), food cost percentage, table turnover rate, and labour cost percentage. These KPIs directly affect both guest experience and financial performance, and they are typically measurable with data that already exists in your POS and KDS systems.
How long does it take to set up an automated restaurant KPI dashboard, and what systems need to be integrated?
A focused pilot dashboard covering three to five KPIs for a single outlet can typically be operational within four to eight weeks from project kick-off. The core integrations required are your POS system, your KDS, and your inventory management system. Delivery platform integrations — Gojek, Grab, and ShopeeFood — add additional complexity but are achievable via official merchant APIs.
What is the expected ROI from automating restaurant KPI reporting, and how quickly will we see results?
Indonesian restaurant operators implementing KPI automation typically see measurable operational improvements within the first 60–90 days of a focused pilot: reduced food waste, faster ticket times, and better labour allocation are the earliest wins. Full financial ROI is generally achieved within six to twelve months for mid-scale operators.
Can InReality Solutions integrate with Gojek, Grab, and local Indonesian POS systems?
Yes. InReality Solutions has experience integrating with Indonesian delivery platforms including Gojek and Grab via their official merchant APIs, as well as with locally prevalent POS systems such as Moka alongside international platforms like Lightspeed, Square, and Toast. Our ETL architecture consolidates data from heterogeneous source systems into a unified data mart.
Why should we choose InReality Solutions over a generic SaaS dashboard tool?
Generic SaaS dashboard tools work well when your data sources are standard and your integration requirements are straightforward. Indonesian restaurant operators often face a more complex reality: multiple POS systems across outlets and delivery platform data that does not conform to standard schemas. InReality Solutions builds custom integration layers tailored to your specific stack, and our agentic AI capability means your dashboard can generate natural-language recommendations and escalate exceptions automatically.

Founder & Managing Director · LinkedIn
Ready to Build Your New Reality?
Tell us about your brand and goals — we'll show you what's possible.